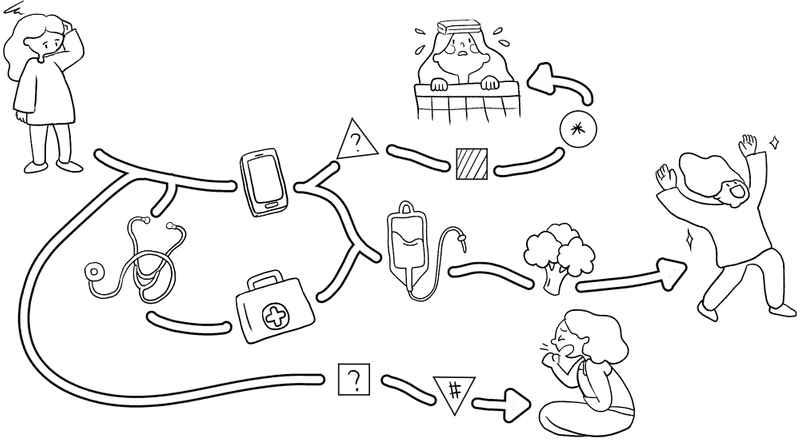
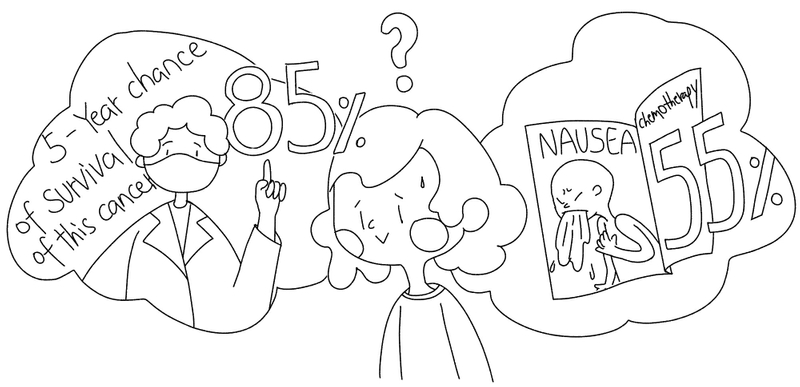
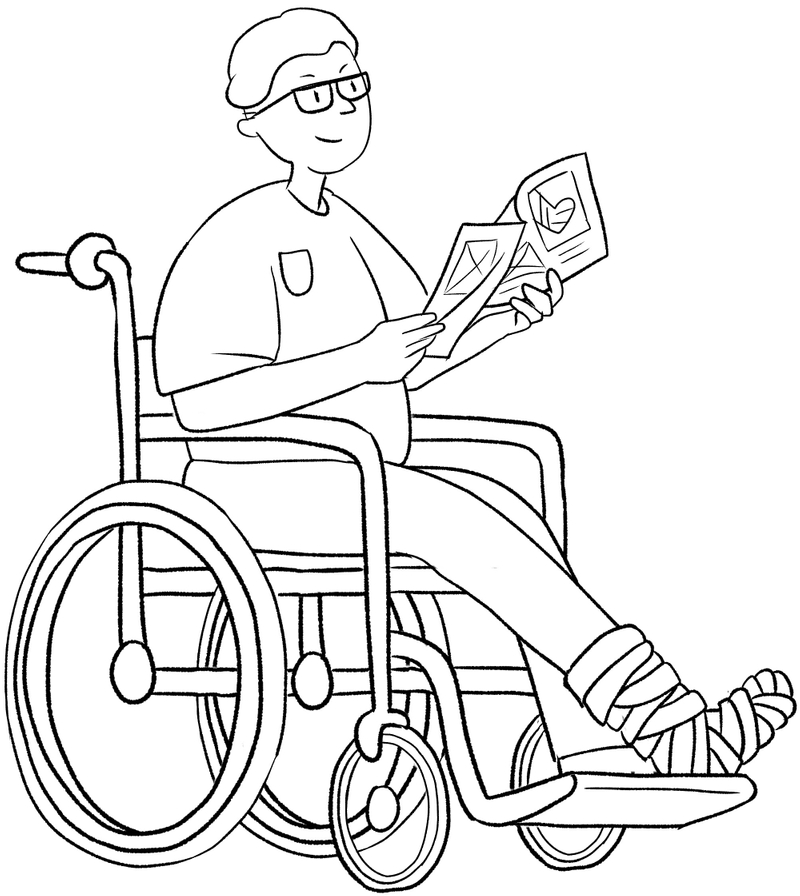
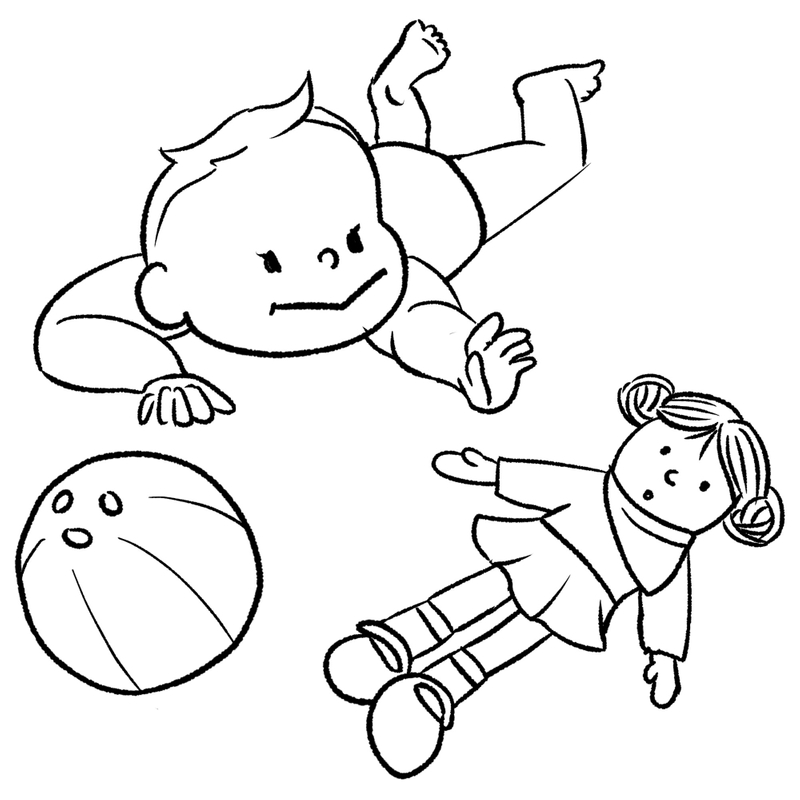
In healthcare, clear communication that can be easily understood by a broad patient audience is more important now than ever.
But all too often, complex medical information is unsuccessfully communicated to populations with poor health literacy, which can have devastating outcomes.
Our research explores how incorporating visual information in healthcare communication, and specifically the use of human faces in health infographics, can improve patients' understanding of critical instructions and information.
The U.S. Department of Health and Human Services (HHS) defines health literacy as “the degree to which individuals have the capacity to obtain, process, and understand basic health information needed to make appropriate health decisions.”
More than a third of Americans have low health literacy, especially among the elderly, individuals with lower socioeconomic status, and those with low English proficiency.
People with low health literacy are often unable to derive meaningful information from health education materials, which are often written at high school or college level.1
Many Americans have low numeracy skills, increasing the effort patients exert in calculating risk and comparing options when making medical decisions.2
Not unexpectedly, healthcare outcomes worsen, and costs substantially increase for Americans with low health literacy. Compared to those with proficient health literacy, adults who have low health literacy experience:3

2-day longer hospital stays

6% more hospital visits

4x higher healthcare costs
Through all of its impact – medical errors, increased illness and disability, loss of wages, and compromised public health - low health literacy is estimated to cost the U.S. economy up to $238B per year.4
When conveying complex information, there are a number of benefits that come from incorporating visuals.
Incorporating visuals adds several benefits in communication, increases people’s understanding of information significantly, from 70% to 95%.5
People following directions with text and illustration do 323% better than those without illustrations.6
Overall, visual information is faster and more effective, taking nearly 1/10 of a second to process compared to the 60 seconds needed to understand an equal amount of written information.7
Healthcare communications should have visuals for individuals to best process the information at hand.
In one study published in the Annals of Emergency Medicine, patients were tested with discharge instructions with and without illustrations.
Patients given illustrations were 1.5x more likely to choose 5 or more correct responses than those without illustrations (65% vs 43%).8
Similarly, another study that used wound care instructions received similar results, with better results for clarity, ease of understanding, correct answers, and compliance to care for illustrations rather than instructions with no illustrations.9
Humans are born to look at faces.
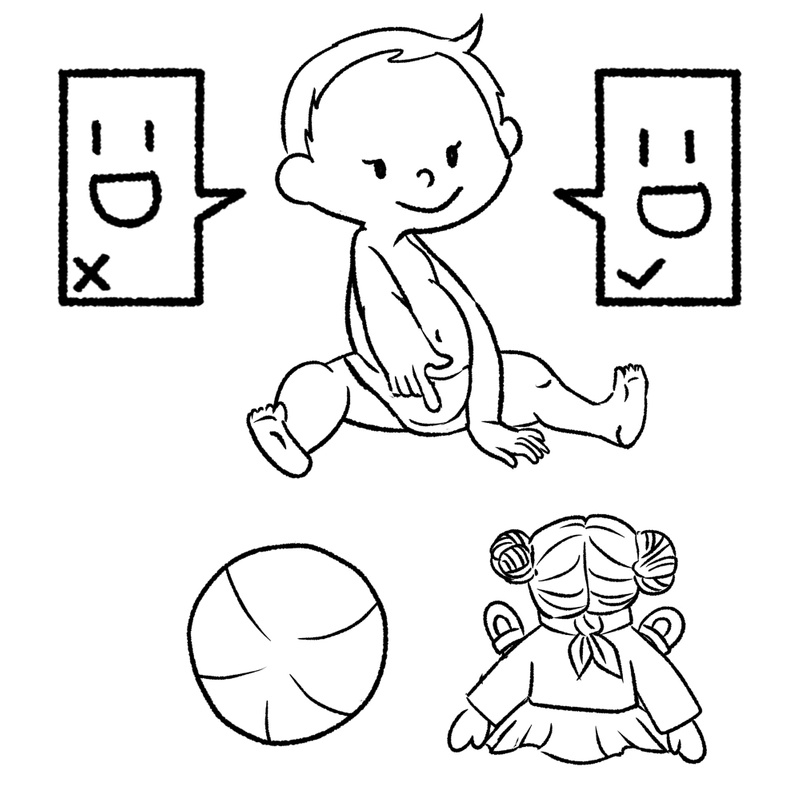
From the very beginning of our lives, we look to others’ faces to ascertain vital information. CONSPEC/CONLERN, a two-process theory of infant face recognition proposed by Johnson and Morton, explains how newborns use innate knowledge about the structure of faces.10
CONSPECGuides an infant’s preferences for facelike patterns from birth.
11, 12, 13, 14, 15, 16 2 Days Old
Frontal Lobe
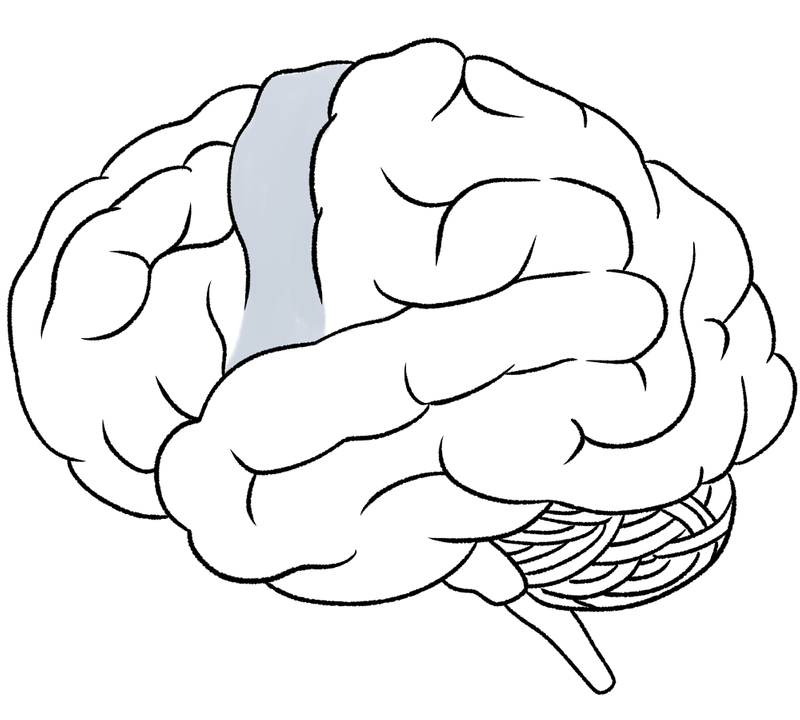
Infants spend a longer time looking at face that are arranged properly. As early as two days old, newborns are able to discriminate between averting eye gaze and direct gaze.
CONLERNA cortical visuomotor mechanism. These subcortical structures support the development of specialized cortical circuits that we use as adults.
17, 18, 19, 20, 21, 22 2 Months Old
Motor Cortex
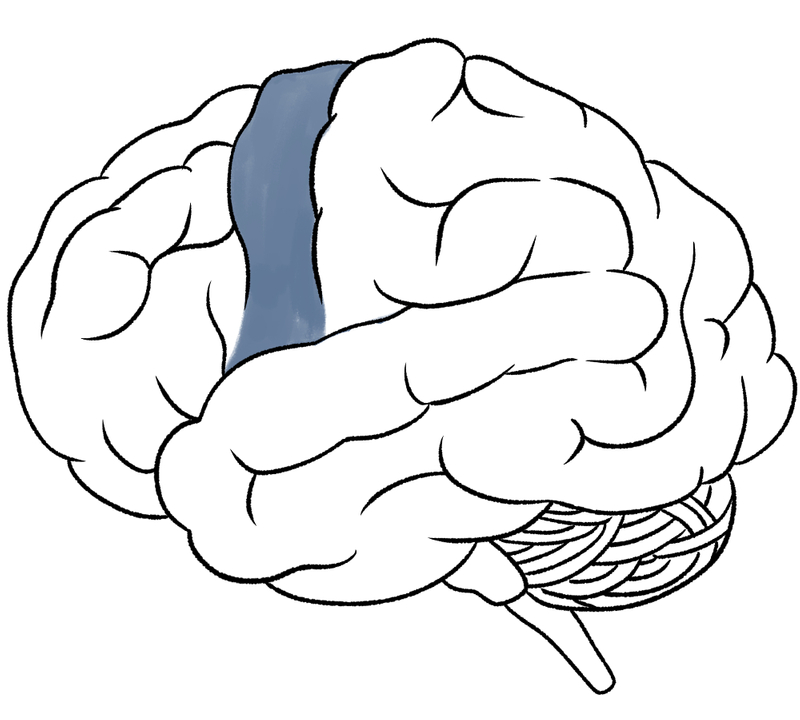
Infants learn to prefer a realistic human face through their cortical visuomotor mechanism.
4 Months Old
Occipital Lobe
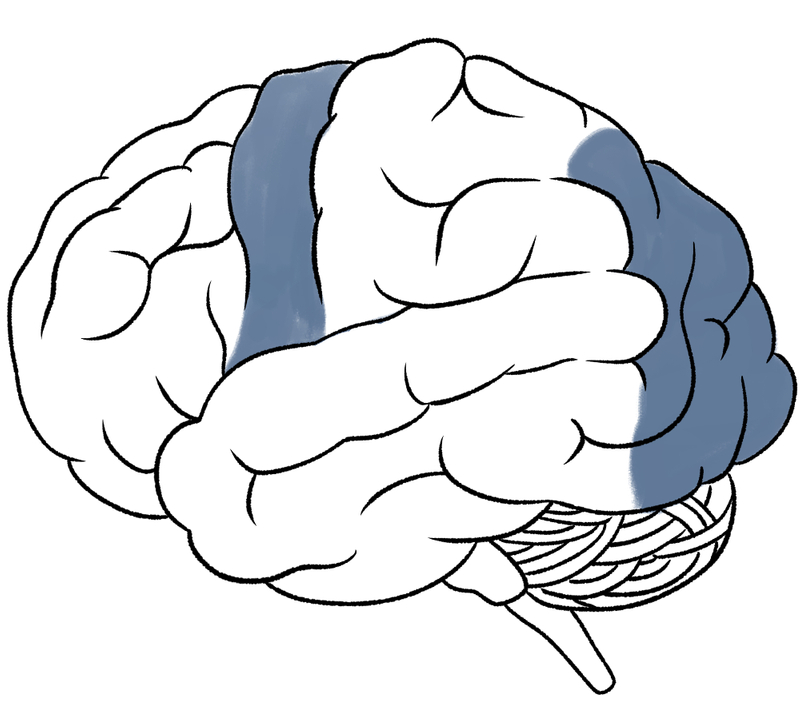
Infants can simulate neural responses in their temporal lobe to a level similar to adults.
The lower level of the visual processing system in the occipital lobe is responsible for analyzing non-facial images.
9 Months Old
Temporal Lobe
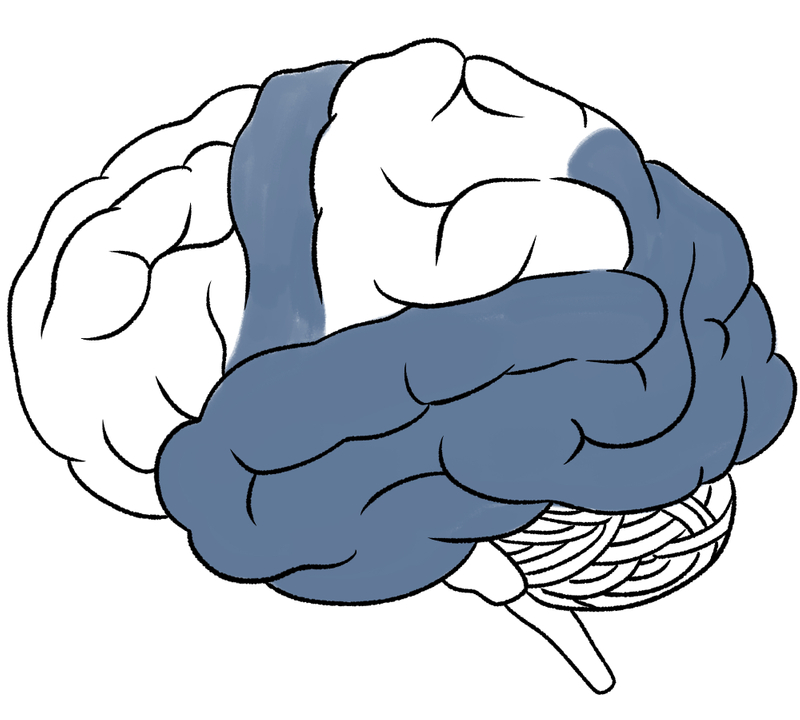
Infants develop joint attention, where they can purposefully coordinate their attention with that of another person.
Although we may share the same biological networks for processing faces, individuals from different cultural backgrounds have different methodologies for looking at faces.23

Western Caucasians tend to fixate more on the eyes and single details, forming a triangular scan of one’s face.24

East Asians tend to integrate information holistically by focusing on the center of the face.25
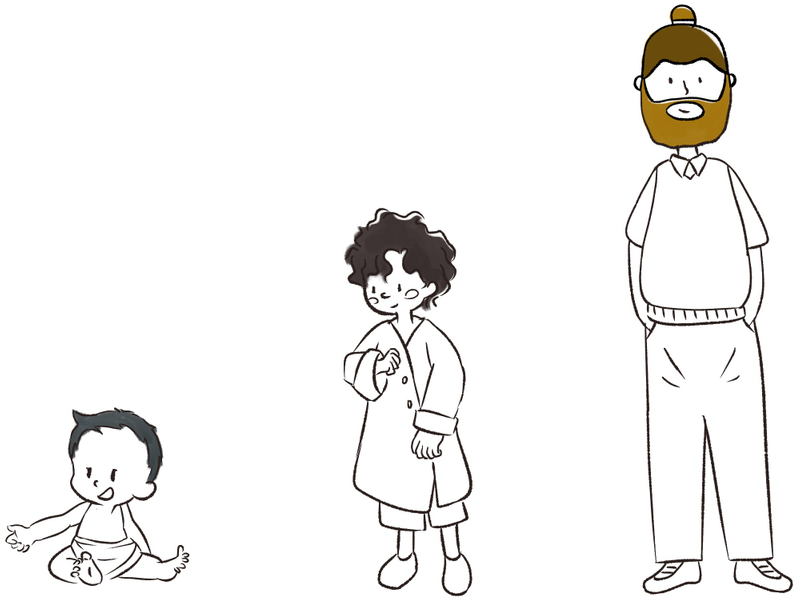
Unsurprisingly, humans tend to gravitate towards faces similar to their own. Infants have shown the own-race bias (ORB)26, recognizing their own faces better than the faces of another race.
Eye-tracking surveys revealed that infants consistently fixate longer on their own-race face regardless of age, compared to a decline in fixation time as they age for other-race faces.27
This declining trend is associated with decreased recognition memory for other race faces. This trend continues into adulthood. After thirty years of investigating the own race bias, ORB has been consistently found across different cultures and races, including individuals with Caucasian, African, and Asian ancestry28 and in both adults29 and children30 as young as 3-month old infants.31
Our brains are wired to engage and respond to human faces, which making them critical to communication. Not only do humans naturally gravitate to faces, but they remember better and mentally engage with information depicting individuals who are similar to them.
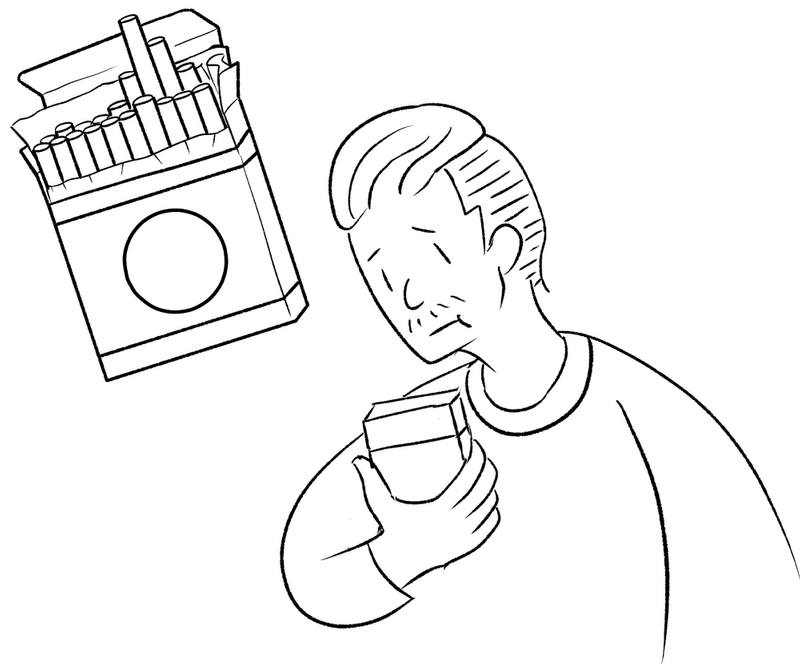
Healthcare graphics and health campaigns rely heavily on emotion to motivate behavior. When individuals are exposed to these messages, they may express three pathways of emotions32 — plot-referent, message-referent, and self-referent.
Message-referent
Anti-smoking messaging and images: Disgusted to the tar lining
Plot-referent
Anger and sadness for the smoker
Self-referent
Shame for their own smoking

These narratives have the power to touch our emotions,

These narratives have the power to touch our emotions,
impact what we believe,
teach us new behaviors.
We fully experience the self-referent emotion when we recognize a relationship between a message and ourselves. This emotion influences how we perceive the possible outcomes and severity of consequences of an action.33 There is a clear distinction between recognizing a risk which triggers an emotional response and experiencing an "enduring perception of future risk" influenced by self-referential emotions.34
For example, adult smokers reduced cigarette consumption and increased intentions to quit when they could see themselves reflected in the messaging.35
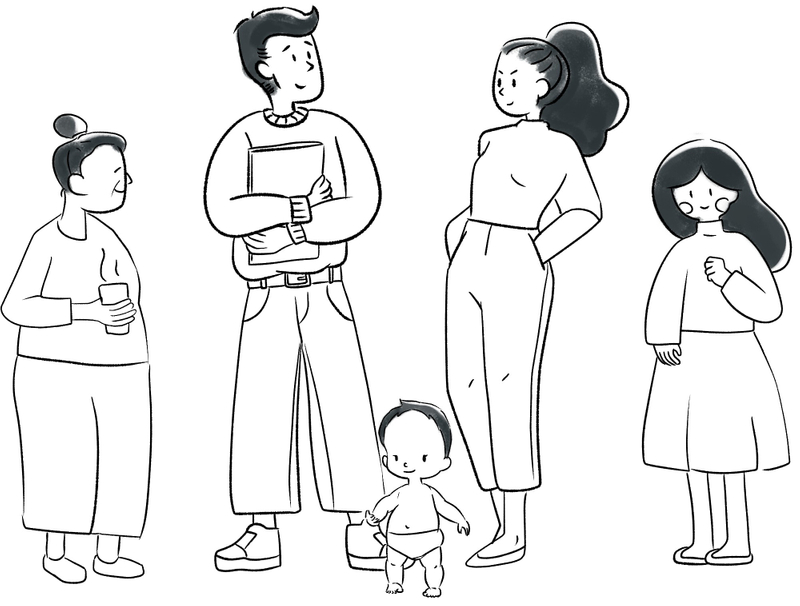
Self-referent emotions surface when the reader relates to the narrative, diverse representation in infographics makes these narratives more effective.
Prioritize higher engagement to effectively communicate critical information to patients with low health literacy.
Emphasize the usage of infographics to improve the understanding of health messaging and instruction.
Showing diverse human faces in healthcare communication can further engage readers, influence how the message is understood, and elicit self-referent emotions that encourage behavior change.
To learn more about how healthcare visuals and the use of faces in particular, improve engagement and emotional understanding, the GoInvo health design studio devised a lean experiment.
Using Amazon’s Mechanical Turk (Mturk) service, we conducted a national survey of over 400 people, age 18 and over, testing the comprehension of information graphics both with and without faces.
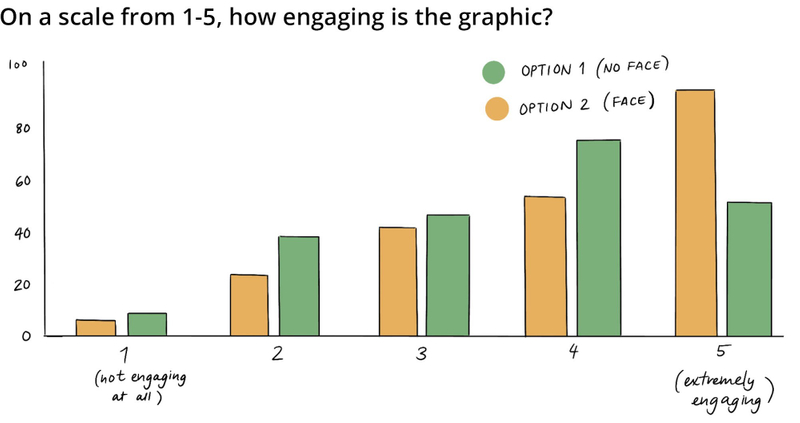
Findings from our survey showed that respondents had a clear preference for information graphics that used faces versus those that did not.
Additionally, the faces in the information graphics played an important role in how the respondents understood the emotional content of the message.
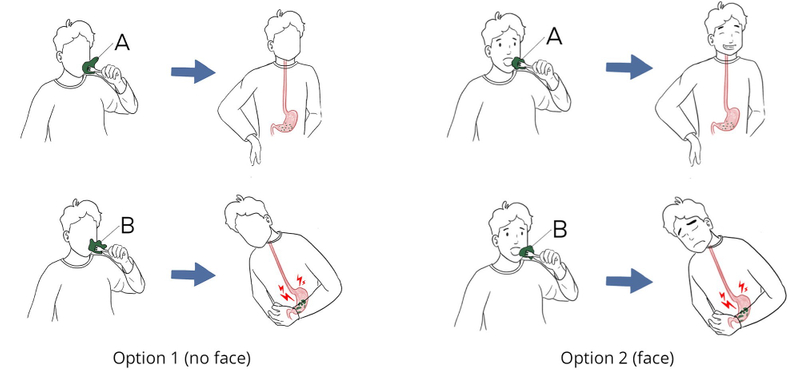
For our first test, individuals were surveyed with one of the two graphics below.
We asked respondents to rank the boy’s emotions on a scale of 1-5, from unhappy to happy. Individuals who saw Option 1 (no face) thought the boy eating A ranked at a 4, while individuals who saw Option 2 (face) thought that the boy ranked at a 5 in happiness.
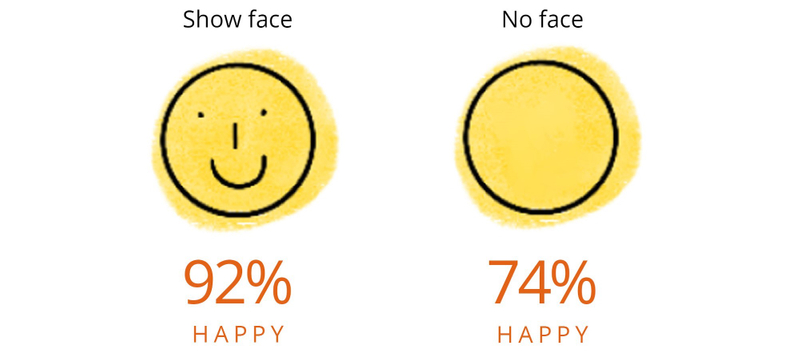
When answering the question, “Is the boy happy after eating blob A?” Only 74% of those respondents who saw the option without a face selected “yes”, versus nearly 92% of those respondents who saw the option showing a face.
In this first test — that the boy was happy eating blob A, the respondents’ emotional understanding of the content increased due to including a facial expression in the infographic.
For our second test, the addition of body language to the infographic gave respondents another piece of information to interpret.
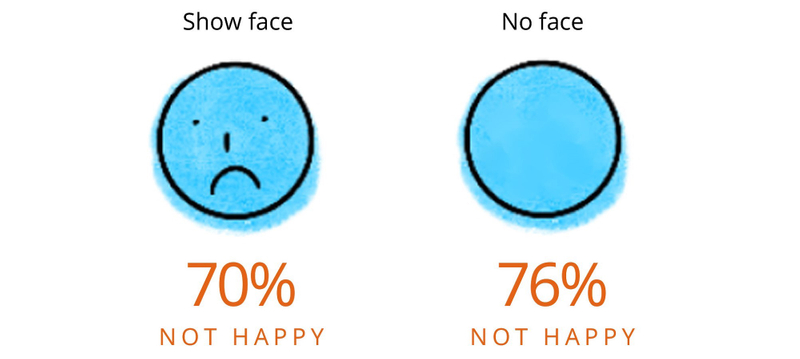
Regarding the boy eating blob B, 76.2% of respondents given the without-a-face option ranked the boy at a 1 (unhappy), while 70.1% of the showing-a-face option respondents ranked the boy at a 1 (unhappy).
While the majority of respondents understood that the boy was unhappy, those who relied solely on body language interpreted greater unhappiness than those who had the additional facial information. The addition of facial expression in this case, seemed to mitigate the message that the boy was unhappy.

